Jordan: Measuring Facebook live-streaming interference during protests
Issa Mahasneh (Jordan Open Source Association), Simone Basso (OONI)
2019-06-12
Last December, anti-austerity protests erupted in Jordan against a controversial fiscal reform bill. The protests ensued once a week for several weeks thereafter. Amid the protests, locals reported that they were unable to view live-streaming from Facebook. But they also reported that viewing live-streaming was otherwise possible when protests were not taking place.
Therefore, our first hypothesis was that perhaps people in Jordan couldn’t load videos on Facebook because they were using overloaded networks (rather than Facebook live streaming being interfered with).
To examine this hypothesis and investigate further, we:
Enumerated Facebook cache servers to identify and map out those located in Jordan.
Tested the Facebook cache servers in Jordan, using OONI Probe. OONI measurements presented anomalies, providing signals of potential interference.
To explore further and in more depth, we ran a series of experiments using cURL.
Mosts tests were run on Zain Jordan (AS48832), while some tests were also run on Umniah (Batelco Jordan) (AS9038), DAMAMAX (Al-Hadatheh Lil-Itisalat) (AS47887), VTEL (AS50670), and Orange Jordan (Jordan Data Communications) (AS8376). The testing period started on 30th November 2018 and concluded on 10th January 2019. We tested Amman-based and London-based video cache servers.
As part of such testing, we were able to rule out the hypothesis that Facebook users in Jordan couldn’t live-stream due to overloaded networks.
Our findings suggest that Facebook Live Stream was temporarily interfered with in Jordan during protests between 20th December 2018 to 10th January 2019.
In this report we share our findings in detail, as these methodologies could potentially be useful in examining similar cases elsewhere in the world.
View the pdf version of the report here.
Facebook Video Streaming infrastructure
According to Under the hood: Broadcasting live video to millions (a December 3, 2015 blog post by Federico Larumbe and Abhishek Mathur on code.fb.com) Facebook live streaming takes advantage of Facebook’s multi-layered cache infrastructure, and uses a mixture of HTTP Live Streaming and RTMP to deliver content to users. This cache infrastructure is called FBCDN, i.e., Facebook Content Distribution Network. A June 2016 recap of a May 2016 talk by Larumbe during Networking@Scale adds the precious bit of information that Facebook was at the time also experimenting with the MPEG-DASH streaming technique. A subsequent talk by Sachin Kulkarni at QCon London 2017 indicates that in 2017 Facebook was definitely transitioning over increasingly using MPEG-DASH as its main streaming technique.
In this section we describe Facebook’s cache infrastructure, and how Facebook is using MPEG-DASH streaming to deliver video content. This discussion will allow us to contextualise our measurements and to justify our choice of focusing on the HTTP and HTTPS reachability of Facebook cache servers during the protests.
Facebook’s cache infrastructure
FBCDN is a multi-layered cache architecture to make video streaming (as well as accessing pictures) as smooth and swift as possible for users worldwide. We share a simplified description of how this architecture works, based on our understanding of “An analysis of Facebook photo caching”, a 2013 article included in the Proceedings of the Twenty-Fourth ACM Symposium on Operating Systems Principles. The following picture, extracted from Arun Moorthy’s talk “Connecting the World: A look inside Facebook’s Networking Infrastructure” slides, should probably be helpful to follow the discussion (but keep in mind that Facebook infrastructure has evolved significantly since then to include many more servers).
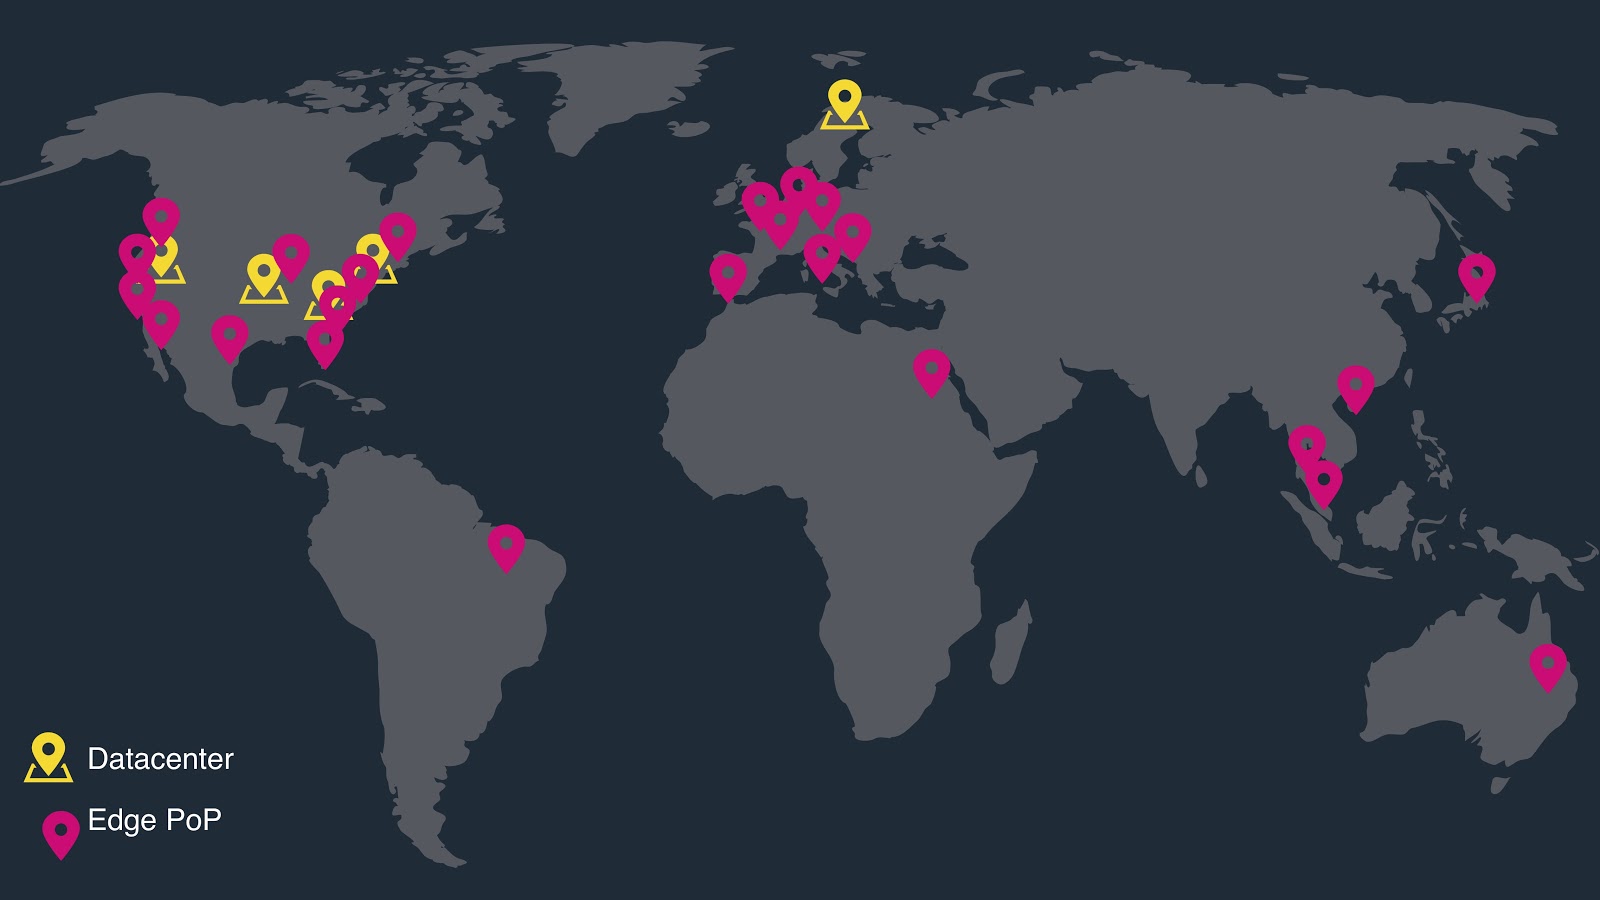
Let’s assume we have a live video streaming on Facebook. This live video streaming has a specific unique content identifier. When you access this content by navigating on Facebook, the code of the webpage (or of the mobile app) requests an edge cache node to return that specific bit of content. An edge cache is a web server deployed into (most likely) your Internet Service Provider (ISP) that may be storing a copy of (bits of) the specific live video you want to see. The place where the edge cache is deployed is often called Point of Presence (PoP). This is what is indicated with the Edge PoP label in the above figure.
As mentioned, your browser will issue an HTTP request using the specific content identifier, and the edge cache will return the video immediately to you, if present. Since the PoP is part of your ISP, if the video is cached, you’ll likely get a response back in a few tens of milliseconds.
Otherwise, the edge cache will reissue the original request on your behalf to a higher-level cache called origin cache. That is another web server that is most likely deployed into a Facebook data center inside of Facebook’s portion of the internet (this is what is labelled as datacenter in the above figure). This data center is further away from you (as we’ll see in a moment). Therefore, the request and the response would need to travel more and would perhaps encounter cross traffic on the way. The bottom line is that you will get a response back in a few hundred milliseconds. That is, you will stare for some noticeable (by you) amount of time at the spinner announcing to you that the video will eventually load.
Likewise, if the content is not available, the origin cache will forward the request to the ultimate authority, that is, the Facebook servers that actually store the data, called haystacks in the aforementioned article. These servers are further away, therefore, when accessing a video that is only in a haystack server, you will potentially need to wait for several hundred milliseconds.
To keep you as happy as possible, Facebook strives to keep frequently requested videos in a specific region as close as possible to users. To implement that, all the caches make sure that they store frequently requested videos, such that subsequent requestors will get them as quickly as possible. The unique identifier for each video is what enables such optimisation. The difference in performance between accessing a video (or other content) using an edge cache vis a vis accessing the same content from an higher-level cache is shown in the following picture (also from Arun Moorthy ’s slides).
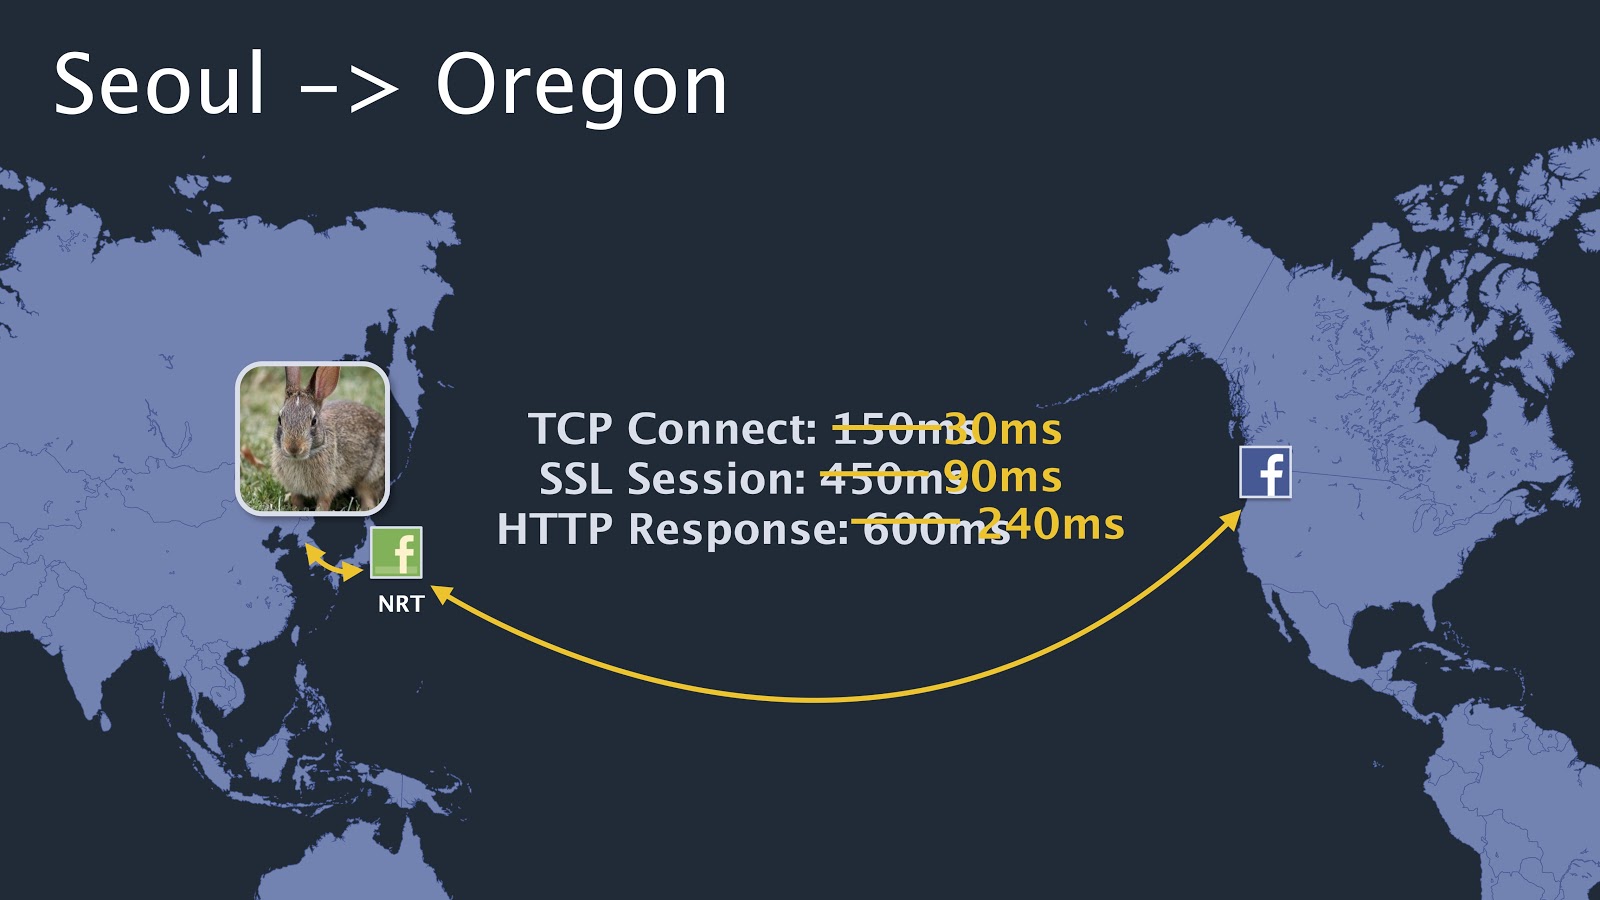
In this example, you can see that accessing a rabbit’s picture from the Seoul cache takes 240 milliseconds, while it would have taken 600 milliseconds to fetch it from Oregon.
Mapping Facebook caches in Jordan
When researching information useful to write this report, we encountered the excellent work done by Anurag Bhatia in 2018 in mapping Facebook edge caches worldwide. He also provides a list of the caches he discovered (last updated on 30th August 2018). Inspired by his methodology, we enumerated all the Facebook edge caches in Jordan in December 2018.
There are 9 cache servers in edge nodes, serving Facebook videos, distributed between several operators, namely Zain (3), Orange (2), Umniah (2), DAMAMAX (1) and VTEL (1).
The following table shows the nodes and their respective operators and IP addresses.
video.famm1-1.fna.fbcdn.net 151.248.101.210 ASN59605    Mena Levant W.l.l (Zain Group - Wholesale)
video.famm2-1.fna.fbcdn.net 46.32.101.18    ASN48832    Linkdotnet-Jordan
video.famm2-2.fna.fbcdn.net 94.142.38.210   ASN48832    Linkdotnet-Jordan
video.famm3-1.fna.fbcdn.net 37.152.6.210    ASN9038     Umniah Lil-Hawatef Al-Mutanaqelah Co.
video.famm3-2.fna.fbcdn.net 37.152.3.146    ASN9038     Umniah Lil-Hawatef Al-Mutanaqelah Co.
video.famm4-1.fna.fbcdn.net 178.20.189.146  ASN50670    Vtel Holdings Limited/jordan Co.
video.famm5-1.fna.fbcdn.net 82.212.80.146   ASN47887    DAMAMAX Jordan
video.famm6-1.fna.fbcdn.net 212.34.28.82    ASN328126   Jordan Telecommunications Company (Orange-cdn)
video.famm7-1.fna.fbcdn.net 212.34.28.146   ASN328126   Jordan Telecommunications Company (Orange-cdn)
The FBCDN uses IATA airport codes to differentiate hostname locations, in a logical pattern similar to video.fXXX1-1.fna.fbcdn.net, where XXXis the 3-letter closest airport IATA code, while the digits 1-1 could be assumed to represent the first (i.e. number 1) point of presence (PoP) in the ISP numbered 1 in that area.
Additional PoPs are numbered sequentially. For example, the string video.famm5-1.fna.fbcdn.net indicates that the first (1) Facebook CDN PoP is hosted in Amman (AMM airport code) at an ISP numbered as 5 (DAMAMAXin this case), whereas a video hosted at video.flhr1-1.fna.fbcdn.net would be served from an ISP in London (LHR).
What’s important to mention in this context is also that Facebook uses different domain names for caches devoted to video and to static content. A video cache has a name starting with video, while a static cache (e.g. for images) has a name starting with the word static. This is interesting because, in theory, it allows an adversary to prevent someone from accessing video caches without hindering their ability to download images and other static content (e.g. JavaScript).
How are live videos served on Facebook?
This section shows the results of a live experiment showing how Facebook live streaming works in practice. With the help of a friend who is on Facebook (thanks!), we created a closed group where we shared a live video streaming. Using the Google Chrome developer tools, we captured and analysed the requests.
This experiment was performed on 6th June 2019. The video was really not popular, since it only had one viewer. Both the person streaming the live video and the person viewing it were located in Italy. More specifically, the person viewing the video was located in Catania, Sicily. The following describes what we observed.
The video playback started with the following HTTP request (where several details have of course been redacted to avoid leaking sensitive information in this report):
GET /video/video_data_async/?video_id=ID&supports_html5_video=true&... HTTP/1.1
Host: www.facebook.com
Note that the request was sent to Facebook’s main domain (www.facebook.com), therefore no cache has been hit at that point. Also note that the query string included the redacted video ID and the information that we supported HTML5 video.
The HTTP/2 response to this request was positive (i.e. :status: 200) and the body included a 10 KiB piece of JavaScript, a relevant excerpt of which we share below.
for (;;);
{
  "payload" : {
    "hd_src" : "https:\/\/video-fco1-1.xx.fbcdn.net\/[snip].mpd?[arguments]",
  }
}
What’s interesting in this response is that it contains the domain name of a video cache (FCO is the Rome Fiumicino airport IATA code). It’s also relevant to note that the URL returned in the JavaScript contains a file name ending with the mpd extension. MPD means Media Presentation Description in this context, and identifies an XML file name used by MPEG-DASH to describe the various pieces of which a streamable video is composed.
The subsequent HTTP request fetches the MPD document from the Rome cache and the successful response includes the MPD document, of which we show an excerpt:
<MPD publishTime="2019-06-06T01:48:58-07:00">
  <Period>
    <AdaptationSet>
      <Representation
        mimeType="video/mp4"
        FBQualityLabel="360p">
        <SegmentTemplate
          initialization="BASEURL-init.m4v"
          media="BASEURL-$Time$.m4v">
          <SegmentTimeline>
            <S t="800" d="2000"/>
            <S t="2800" d="2033"/>
            <S t="4833" d="2034"/>
          </SegmentTimeline>
You can see that the time when the live video was published is 2019-06-06T01:48:58-07:00, that the video is using the video/mp4 (i.e. MPEG-4) technology, and that the video consists of an initial segment (BASEURL-init.m4v) and three additional segments (BASEURL-init.m4v). Consistently with the MPEG-DASH standard, each video is divided into segments of tentatively equal duration.
For each additional segment, the MPD indicates the time when it starts (relative to the beginning of the video; in milliseconds) and the segment duration. So, for example, the second segment (<S t="2800" d="2033"/>) starts after 2.8 seconds and has a duration of roughly two seconds.
If we continue to analyse the output provided by Chrome’s developer tools, we see for example that, at a certain point, the browser fetches the second segment with this request:
GET BASEURL-2800.m4a
Host: video-fco1-1.xx.fbcdn.net
What is relevant in this request is that it is directed towards the Rome cache and that the URL used explicitly indicates the video segment starting after 2.8 seconds.
This spot experiment is similar to earlier, spot-on experiments that we performed in December 2018 from Jordan, when helping friends to understand what live streaming was not working well for them, as described in the following section.
Facebook Live streaming issues
During the protests (between December 2018 to January 2019), people in Jordan reported that they were unable to load most of the videos from Facebook.
When they clicked on a video to reproduce it, a loading spinner would run for several seconds until an error on a black background would appear, as show below:
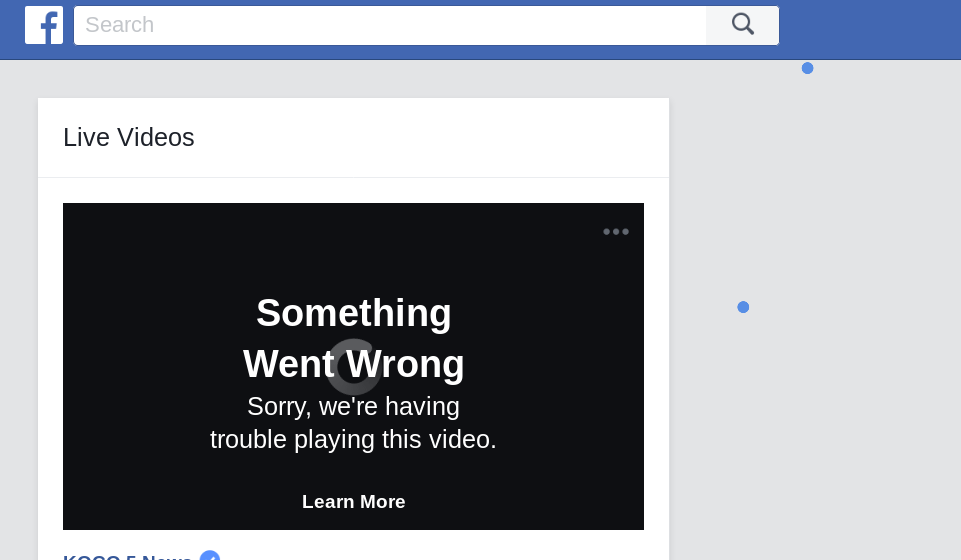
This behaviour was common on different devices, web browsers on desktop and mobile, and on the Facebook Android and iPhone applications. However, the video thumbnails were visible, while some other non-live videos were playable.
Knowing, as mentioned above, that Facebook uses servers to provide static content (like video thumbnails) that are separate to the ones streaming videos, we ensured that static content caches were available, whereas video caches were not. We performed this check using Firefox developer tools and browsing on Facebook. Any failed video request did not prevent Facebook from serving us static content, like video thumbnails.
Apart from loading videos, users in Jordan were, in fact, able to use Facebook normally, as traffic to other content did not appear to be subject to any anomalies. It is also worth mentioning that other online video services, like YouTube, were not affected by this incident (of course, this is also because their content is not provided by Facebook’s infrastructure). On 20th December 2018, though, we received reports that some people in Jordan were unable to play Periscope videos on Twitter during the protests, but we were unable to examine and confirm this. To conclude, the only user-reported anomalies were limited to the traffic from Facebook’s video cache servers.
OONI Probe tests
In an attempt to examine why Facebook users in Jordan couldn’t live stream, we ran OONI Probe to measure the accessibility of Facebook’s video cache servers.
More specifically, we ran OONI Probe’s Web Connectivity test to measure the potential DNS, TCP/IP, or HTTP blocking of Facebook video cache servers. These tests were run from local vantage points in Jordan on Zain Jordan (AS48832), Umniah (Batelco Jordan) (AS9038), DAMAMAX (Al-Hadatheh Lil-Itisalat) (AS47887), VTEL (AS50670), and Orange (Jordan Data Communications) (AS8376) between 30th November 2018 to 20th December 2018. All measurements collected from these tests have been openly published.
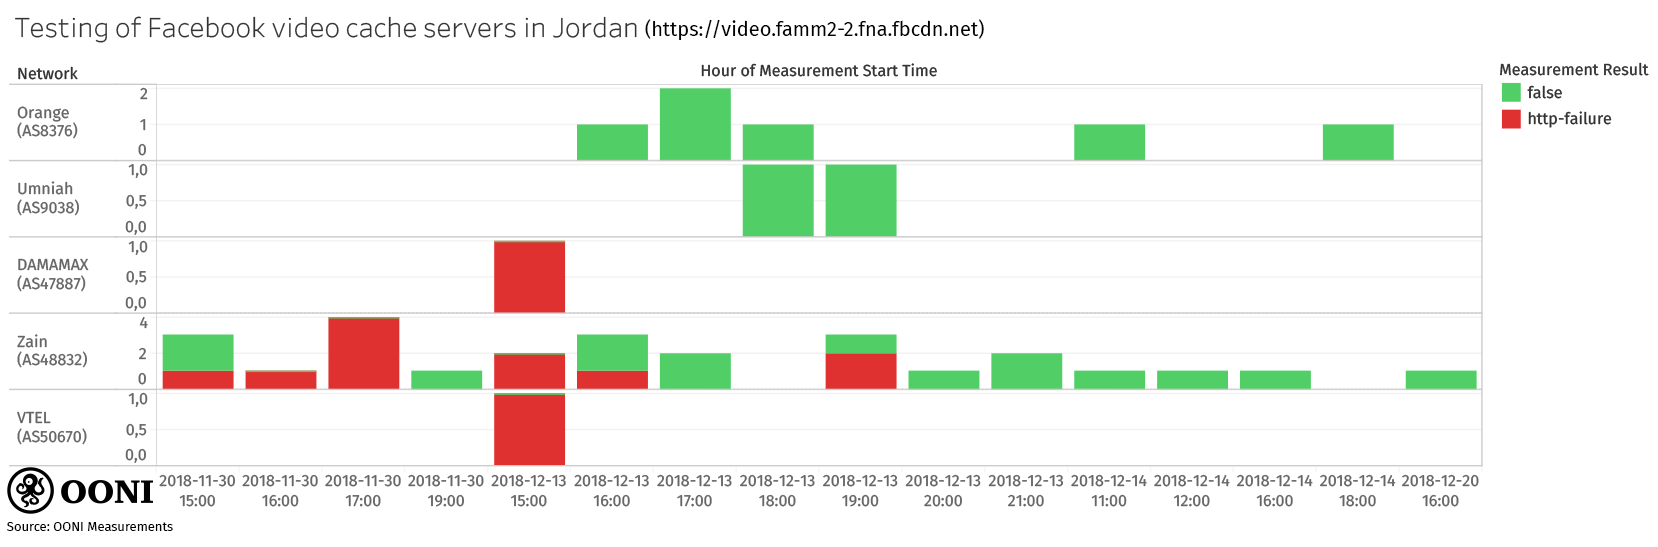
We found that the testing of Facebook video cache servers presented anomalies.
Videos that were unable to load were supposed to be served from the video cache servers of Facebook, but requesting such videos resulted in connection reset errors and generic timeout errors (while the normal behaviour would have been to get a successful response from the server). Through OONI measurements, we observed these anomalies on Zain Jordan (AS48832), DAMAMAX (Al-Hadatheh Lil-Itisalat) (AS47887), and VTEL (AS50670) on 30th November 2018 and 13th December 2018 (during protests).
What’s more, we noticed network anomalies not only with Amman cache servers, but also with London cache servers when accessed from Jordan. We also observed that timeout errors were more common for London cache servers, while Amman cache servers reacted with a mixture of timeout errors and connection reset errors.
The testing of Facebook video cache servers didn’t always present anomalies. In fact, most measurements established successful connections and DNS lookups. The graph below illustrates the normal and anomalous measurements collected from local vantage points when a Facebook video cache server (https://video.famm2-2.fna.fbcdn.net/) was tested between 30th November 2018 to 20th December 2018.
 Source: OONI measurements: Jordan, https://explorer.ooni.io/country/JO
The measurements used to generate the above chart are available via this CSV.
It’s worth highlighting though that the anomalies were observed (on several networks) more frequently during protests, rather than before and after the protests. This led us to speculate that perhaps the anomalies were caused by network overload, rather than by deliberate interference. To understand whether this hypothesis was sound, we investigated further through custom experiments.
Custom network measurement tests
We ran cURL experiments on Zain Jordan (AS48832) during and after the protests in Amman, on 20th December 2018, 27th December 2018, 3rd January 2019, and 10th January 2019. Each experiment was performed multiple times. Below we share a sample output and packet captures analyses pertaining to a single experiment (since they were all similar).
We started by checking whether one of the Facebook caches in Amman (named famm2-2 where the f probably means Facebook and amm most likely indicates Amman, as explained above) was reachable using the HTTP protocol. The following is the result that we obtained during the protests:
$ curl -v http://video.famm2-2.fna.fbcdn.net
* Rebuilt URL to: http://video.famm2-2.fna.fbcdn.net/
*   Trying 94.142.38.210...
* Connected to video.famm2-2.fna.fbcdn.net (94.142.38.210) port 80 (#0)
> GET / HTTP/1.1
> Host: video.famm2-2.fna.fbcdn.net
> User-Agent: curl/7.47.0
> Accept: */*
>
Recv failure: Connection reset by peer
* Closing connection 0
curl: (56) Recv failure: Connection reset by peer
The logs emitted by cURL indicate that (1) the connection was established (Connected to ...) and (2) after the request was sent, we received a [c]onnection reset by peer error.
This error is generated when TCP receives a segment that does not look correct in the context of the connection. A classical textbook example is when you have a persistent connection to a server that crashes and reboots: attempting to write to such a connection will cause the server to send you a reset error because it rebooted and it knows nothing about the TCP segment that you just sent it (see Unix Network Programming, Section 5.15).
This connection-reset-by-peer error is also generated when a TCP peer wants to close the connection and force the other peer to throw away any queued data. This property of resetting a TCP connection is also exploited by the TCP reset attack, when a fake segment is spoofed to cause a TCP endpoint to shutdown immediately without sending any queued data.
From the logs presented so far, we cannot say directly that the reset segment was the result of an attack. Certainly, it is telling that the reset is received after sending the HTTP request, which contains the video cache host header in plaintext (Host: video.famm2-2.fna.fbcdn.net, as shown in the CURL logs). However, we cannot exclude that high load caused by people accessing the video cache may be causing the server application to misbehave in some weird way and reset the connection. We will continue discussing this topic more in detail later, when we analyse the packet captures.
We also tried using HTTPS, obtaining the following logs:
$ curl -v https://video.famm2-2.fna.fbcdn.net
* Rebuilt URL to: https://video.famm2-2.fna.fbcdn.net/
*   Trying 94.142.38.210...
* Connected to video.famm2-2.fna.fbcdn.net (94.142.38.210) port 443 (#0)
* found 148 certificates in /etc/ssl/certs/ca-certificates.crt
* found 597 certificates in /etc/ssl/certs
* ALPN, offering http/1.1
gnutls_handshake() failed: Error in the pull function.
* Closing connection 0
curl: (35) gnutls_handshake() failed: Error in the pull function.
As before, we establish a TCP connection, then some error occurs. The error message (Error in the pull function) is not very informative, but we understand that the GnuTLS library used by cURL encountered some fatal error during the TLS handshake. That is, during the initial protocol exchange where certificates are transmitted and security properties are negotiated. It does actually seem that we do not make much progress in the handshake, since we do not see output pertaining to the negotiated TLS version, nor we do see output regarding the server certificate.
We again suspect that this is an attack. However, in this case the logs do not even provide us with a clear indication that the connection was reset. All we know is that there was some error in the “pull function” sometime during the TLS handshake. Because “pull function” is a GnuTLS term to indicate the recv system call (or an API compatible replacement), and because we do not see any information on the TLS version in the logs, it is reasonable to assume that the error that we see occurs after we have sent the initial packet of the handshake (ALPN, offering http/1.1), in the recv that waits for the server’s reply. But, again, we cannot exclude that, maybe due to overload, the application server crashes and the connection is closed.
When running the measurements, we were at this point tempted to go straight to the packet captures, to see the sequence of network events, the errors, and other low level properties that may help to understand whether this could be an attack or not. However, since packet captures are not always available in all environments (e.g. when running measurements from mobile devices), we decided to take advantage of this situation in which each test led to a failure, to experiment whether further application level measurements could increase our confidence that we were not facing an overloaded server. Hence, the idea to apply a technique that ΟΟΝΙ started adding to Measurement Kit during the MAMI hackathon in Aberdeen.
This technique calls for connecting to the video cache server and initiating a TLS handshake for another domain, such as www.google.com instead of video.famm2-2.fna.fbcdn.net. Of course, this experiment should always fail because a Facebook video cache server should not be able to authenticate as a Google server. In this specific case, we expected an overloaded server to interrupt the connection attempt as abruptly as before. On the contrary, if the interruption depended on some external factor correlated with the video cache name, it was more likely to see a full handshake followed by the client terminating the connection because it cannot authenticate the server as a Google server. This is indeed what happened:
$ curl -v --resolve www.google.com:443:94.142.38.210 \
        --header 'Host: video.famm2-2.fna.fbcdn.net' \
        https://www.google.com/
* Added www.google.com:443:94.142.38.210 to DNS cache
* Hostname www.google.com was found in DNS cache
*   Trying 94.142.38.210...
* Connected to www.google.com (94.142.38.210) port 443 (#0)
* found 148 certificates in /etc/ssl/certs/ca-certificates.crt
* found 597 certificates in /etc/ssl/certs
* ALPN, offering http/1.1
* SSL connection using TLS1.2 / ECDHE_ECDSA_AES_128_GCM_SHA256
*          server certificate verification OK
*          server certificate status verification SKIPPED
* SSL: certificate subject name (*.famm2-2.fna.fbcdn.net) does not match target host name 'www.google.com'
* Closing connection 0
curl: (51) SSL: certificate subject name (.famm2-2.fna.fbcdn.net) does not match target host name 'www.google.com'
As you can see, we successfully established a TCP connection to the specific cache IP address, performed a successful TLS handshake (SSL connection using TLS1.2...), and received the server certificate. Then, cURL noticed that the certificate presented by the server was not valid (does not match target host name) for the domain we requested (www.google.com) and, as expected, the connection was closed. This additional experiment greatly increased our confidence that we were not facing an overloaded server, but rather some active form of network interference. To explore further, let’s look at the packet captures.
The following is the HTTP experiment capture:
$ tshark -r canned_3_1_1a.acp
1 0.000000 192.168.8.102 → 94.142.38.210 TCP 74 53920 → 80 [SYN] Seq=0 Win=29200 Len=0 MSS=1460 SACK_PERM=1 TSval=35602001 TSecr=0 WS=128
2 0.028508 94.142.38.210 → 192.168.8.102 TCP 74 80 → 53920 [SYN, ACK] Seq=0 Ack=1 Win=27960 Len=0 MSS=1400 SACK_PERM=1 TSval=2764436819 TSecr=35602001 WS=256
    3   0.028619 192.168.8.102 → 94.142.38.210 TCP 66 53920 → 80 [ACK] Seq=1 Ack=1 Win=29312 Len=0 TSval=35602008 TSecr=2764436819
4 0.028835 192.168.8.102 → 94.142.38.210 HTTP 157 GET / HTTP/1.1
5 0.058483 94.142.38.210 → 192.168.8.102 TCP 54 80 → 53920 [RST, ACK] Seq=1 Ack=92 Win=8222720 Len=0
We see the TCP three-way handshake (packets 1-3), then the request is sent (packet 4), and then we finally receive a reset (RST) segment (packet 5). The round-trip time (RTT) of the reset segment (i.e. the difference between the timestamp of packet 5 and the one of packet 4, i.e. 30 ms) is compatible with the RTT of the three-way handshake (29 ms; measured as the difference between the timestamp of packet 2 and the one of packet 1).
We observe that the HTTPS capture tells us a similar story:
$ tshark -r canned_3_1_1b.acp
    1   0.000000 192.168.8.102 → 94.142.38.210 TCP 74 36702 → 443 [SYN] Seq=0 Win=29200 Len=0 MSS=1460 SACK_PERM=1 TSval=35604812 TSecr=0 WS=128
    2   0.054466 94.142.38.210 → 192.168.8.102 TCP 74 443 → 36702 [SYN, ACK] Seq=0 Ack=1 Win=27960 Len=0 MSS=1400 SACK_PERM=1 TSval=4160958854 TSecr=35604812 WS=256
    3   0.054550 192.168.8.102 → 94.142.38.210 TCP 66 36702 → 443 [ACK] Seq=1 Ack=1 Win=29312 Len=0 TSval=35604826 TSecr=4160958854
4   0.124798 192.168.8.102 → 94.142.38.210 TLSv1 349 Client Hello
    5   0.169943 94.142.38.210 → 192.168.8.102 TCP 54 443 → 36702 [RST, ACK] Seq=1 Ack=284 Win=8222720 Len=0
The main difference here is that the RST segment is received after the TLSv1 Client Hello packet (i.e. the packet with which a TLS client greets a server). Again, the RTT of the RST is quite close to the RTT of the three-way handshake. (To be more specific, there is a 10 ms difference, but we also saw a lower RTT in the previous attempt, and since we were using a mobile network, some RTT fluctuations are to be expected.)
Before we focus on the third capture, let’s have a closer look at the Client Hello:
$ tshark -V -2 -R ssl -r canned_3_1_1b.acp
    [snip]
Secure Sockets Layer
    TLSv1 Record Layer: Handshake Protocol: Client Hello
        Content Type: Handshake (22)
        Version: TLS 1.0 (0x0301)
        Length: 278
        Handshake Protocol: Client Hello
            Handshake Type: Client Hello (1)
            Length: 274
            Version: TLS 1.2 (0x0303)
                [snip]
            Extension: server_name (len=32)
                Type: server_name (0)
                Length: 32
                Server Name Indication extension
                    Server Name list length: 30
                    Server Name Type: host_name (0)
                    Server Name length: 27
                    Server Name: video.famm2-2.fna.fbcdn.net
    [snip]
We snipped through most of the output, but the intent here was to show that the Hello packet includes the plaintext name of the server to connect (see the penultimate line). This is the SNI (Server Name Indication) extension. The fact that the server that you are connecting to is in cleartext means that this information can be exploited to prevent you from connecting to that server. (There is ongoing work to standardize ESNI, or Encrypted SNI.)
By looking at these two captures, we conclude that the connection is reset in both cases after some plaintext containing the server name is sent: in the HTTP case, this information is part of the request headers (as shown in cURL logs), while for HTTPS this name is part of the Client Hello (as we have just seen above). This fact was already quite obvious already from the HTTP cURL logs, but was hidden by obscure logging in the HTTPS experiment.
Now let’s see what happens in the experiment where we change the SNI, where it seems that we can perform a more comprehensive TLS handshake:
$ tshark -r canned_3_1_1c.acp
    1   0.000000 192.168.8.102 → 94.142.38.210 TCP 74 37016 → 443 [SYN] [...]
    2   0.047798 94.142.38.210 → 192.168.8.102 TCP 74 443 → 37016 [SYN, ACK] [...]
    3   0.047912 192.168.8.102 → 94.142.38.210 TCP 66 37016 → 443 [ACK] [...]
    4   0.129705 192.168.8.102 → 94.142.38.210 TLSv1 336 Client Hello
    5   0.166521 94.142.38.210 → 192.168.8.102 TCP 66 443 → 37016 [ACK] [...]
    6   0.168029 94.142.38.210 → 192.168.8.102 TLSv1.2 1454 Server Hello
    7   0.168088 192.168.8.102 → 94.142.38.210 TCP 66 37016 → 443 [ACK] [...]
    8   0.170216 94.142.38.210 → 192.168.8.102 TCP 1454 443 → 37016 [ACK] [...]
    9   0.170250 192.168.8.102 → 94.142.38.210 TCP 66 37016 → 443 [ACK] [...]
    10   0.170482 94.142.38.210 → 192.168.8.102 TLSv1.2 339 Certificate,
            Server Key Exchange, Server Hello Done
   11   0.170497 192.168.8.102 → 94.142.38.210 TCP 66 37016 → 443 [ACK] [...]
   12   0.172287 192.168.8.102 → 94.142.38.210 TLSv1.2 141 Client Key Exchange
   13   0.234964 94.142.38.210 → 192.168.8.102 TCP 66 443 → 37016 [ACK] [...]
   14   0.235051 192.168.8.102 → 94.142.38.210 TLSv1.2 117
            Change Cipher Spec, Encrypted Handshake Message
   15   0.255009 94.142.38.210 → 192.168.8.102 TCP 66 443 → 37016 [ACK] [...]
   16   0.255888 94.142.38.210 → 192.168.8.102 TLSv1.2 324 New Session Ticket,
            Change Cipher Spec, Encrypted Handshake Message
   17   0.260381 192.168.8.102 → 94.142.38.210 TLSv1.2 97 Encrypted Alert
   18   0.288728 94.142.38.210 → 192.168.8.102 TLSv1.2 97 Encrypted Alert
   19   0.288988 192.168.8.102 → 94.142.38.210 TCP 66 37016 → 443 [RST, ACK] [...]
   20   0.290564 94.142.38.210 → 192.168.8.102 TCP 66 443 → 37016 [FIN, ACK] [...]
   21   0.290638 192.168.8.102 → 94.142.38.210 TCP 54 37016 → 443 [RST] [...]
For readability, we have omitted part of the tshark output using an ellipsis. The TCP connection is established successfully (packets 1-3), then the Client Hello is sent (packet 4), and the Server Hello is received (packet 6). More messages are exchanged, including packet 10, which contains the certificate in cleartext (an issue that is fixed in TLSv1.3; in this capture the client and the server agreed to use TLSv1.2). Then, there is an exchange of encrypted alerts (packets 17 and 18) where most likely cURL is telling the server to shutdown the TLS channel because, as expected, the server’s certificate is not valid for www.google.com. Finally, cURL resets the connection (incidentally this is a legitimate user of the RST, because cURL really wants to make sure that any data that the other end may have queued is not sent).
After cursorily looking into the packet captures, we are increasingly confident that we are not seeing an overloaded server. Among other things, there does not seem to be significant queue buildup near the server, since the RTTs are reasonably low. Also, the packet captures helped to see explicitly that the TLS handshake is interrupted by a reset when the video cache server name is present, and continues unhindered otherwise. An interesting experiment that we should probably have performed would have been to connect to the server using HTTP and forcing the HTTP host header to be different (e.g., again, www.google.com). However, for this set of experiments, we were mainly focusing on TLS and on validating the field of the SNI blocking detection technique that we recently added to Measurement Kit (ΟΟΝΙ aims to include this in the OONI Probe mobile app).
To conclude our analysis, we decided to perform a more in-depth pass, to see whether it was possible to detect more interesting low level details. One such detail is the value of the IP ID field used by the reset packets. See what happens in the HTTP experiment:
$ tshark -T fields -e frame.number -e ip.src -e tcp.srcport -e ip.dst \
    -e tcp.dstport -e ip.id -e tcp.flags.reset -E header=yes \
    -E separator=, -r canned_3_1_1a.acp
frame.number,ip.src,tcp.srcport,ip.dst,tcp.dstport,ip.id,tcp.flags.reset
1,192.168.8.102,53920,94.142.38.210,80,0x00008e24,0
2,94.142.38.210,80,192.168.8.102,53920,0x00000000,0
3,192.168.8.102,53920,94.142.38.210,80,0x00008e25,0
4,192.168.8.102,53920,94.142.38.210,80,0x00008e26,0
5,94.142.38.210,80,192.168.8.102,53920,0x00003412,1
And in the HTTPS experiment:
$ tshark -T fields -e frame.number -e ip.src -e tcp.srcport -e ip.dst \
    -e tcp.dstport -e ip.id -e tcp.flags.reset -E header=yes \
    -E separator=, -r canned_3_1_1b.acp
frame.number,ip.src,tcp.srcport,ip.dst,tcp.dstport,ip.id,tcp.flags.reset
1,192.168.8.102,36702,94.142.38.210,443,0x00003b7b,0
2,94.142.38.210,443,192.168.8.102,36702,0x00000000,0
3,192.168.8.102,36702,94.142.38.210,443,0x00003b7c,0
4,192.168.8.102,36702,94.142.38.210,443,0x00003b7d,0
5,94.142.38.210,443,192.168.8.102,36702,0x00003412,1
In both cases, the fifth packet is the packet that resets the connection (as indicated by the latest column having a value of 1) and in both cases the IP IDvalue is 0x00003412 (this is indicated in the penultimate column of the output).
Now, a constant IP IDfield is really unexpected. This field is a 16-bit ID, nowadays only used for reassembly purposes. Historically, such a field was a global counter incremented for each packet but, after the idle scan was invented by Salvatore Sanfilippo, most operating systems changed the IP IDto, at least, be depending on the source and the destination addresses and protocols. Nowadays, it should be quite uncommon to see packets with an hard-coded ID value different from zero. Linux sets the ID to zero when sending a packet that must not be fragmented. There is an interesting security discussion regarding whether this is a good thing (because it prevents exfiltrating data) or a bad thing (because it allows the fingerprinting of Linux boxes).
The third packet capture allows us to appreciate in more detail the IP ID pattern used by the video cache. Let’s process again the third packet capture, this time just printing the packet sequence number and the ID (please, use the index to match packets presented here with the complete listing of the third packet capture presented above):
$ tshark -T fields -e frame.number -e ip.id  -E header=yes -E separator=, \
        -r canned_3_1_1c.acp "ip.src==94.142.38.210"
frame.number,ip.id
2,0x00000000
5,0x0000c84a
6,0x0000c84b
8,0x0000c84c
10,0x0000c84d
13,0x0000c84e
15,0x0000c84f
16,0x0000c850
18,0x0000c851
20,0x0000c852
The above output is very interesting because it is consistent with the ID evolution pattern that we see for a Linux box running v4.18, as well as for another box running v4.15. Also, the kernel code for generating such IDs should be generating linear increments for a specific source address, destination address, and protocol unless “a generator is seldom[ly] used”, in which case Linux perturbs the ID to make an idle scan much more complex. We conclude that the video cache server seems to behave like a Linux box, which is probably what Facebook uses, and a hard-coded ID for the reset packets is not compatible at all with the behaviour we have observed from such a server.
Also the time to live (TTL) field can help show how the reset segments are anomalous. We limit our analysis to the second and the third capture.
Here’s the TTL in the second capture, where the packet with index 5 is containing the reset flag:
$ tshark -T fields -e frame.number -e ip.ttl  -E header=yes -E separator=, \
        -r canned_3_1_1b.acp "ip.src==94.142.38.210"
frame.number,ip.ttl
2,88
5,62
And here is the third capture:
$ tshark -T fields -e frame.number -e ip.ttl  -E header=yes -E separator=, \
        -r canned_3_1_1c.acp "ip.src==94.142.38.210"
frame.number,ip.ttl
2,88
5,88
6,88
8,88
10,88
13,88
15,88
16,88
18,88
20,88
It is interesting to note that packets that we believe to be sent by the legitimate server always have a TTL of 88 while the supposedly injected packet has a TTL of 62. This fact, again, seems to suggest that we are dealing with a packet generated by another IP entity.
Conclusion
When we heard that demonstrators in Jordan couldn’t live-stream on Facebook, we investigated whether this was due to overloaded networks, or if Facebook Live Stream was interfered with.
We started off by mapping out the Facebook cache servers to identify those in Jordan and we subsequently ran OONI Probe tests to measure their availability. OONI measurements presented anomalies on Zain Jordan (AS48832), DAMAMAX (Al-Hadatheh Lil-Itisalat) (AS47887), and VTEL (AS50670) on 30th November 2018 and 13th December 2018.
To investigate further and in more depth, we ran a series of custom network measurement tests using cURL. These tests, run on Zain Jordan (AS48832) between 20th December 2018 to 10th January 2019, allowed us to rule out the initial hypothesis (that Facebook users in Jordan couldn’t live-stream due to overloaded networks) and to confirm that Facebook Live Stream was temporarily interfered with during the protests.
We share our research and methodologies to potentially support other research efforts investigating similar incidents in other countries around the world.