Examining internet blackouts through public data sources
Maria Xynou, Arturo Filastò
2017-03-28 16:39 UTC
Pulling the plug on the internet is one of the ways that governments around the
world attempt to exert control over the flow of information.
While the Open Observatory of Network Interference (OONI) project has developed numerous software tests for examining different
forms of internet censorship (such as the blocking of websites, instant
messaging apps, and censorship circumvention tools), we currently do not have
tests that are designed to examine internet blackouts, when the internet as a
whole is rendered inaccessible within a location.
Over the last months we received many reports relating to internet blackouts in
various countries around the world. In some of these countries we had probes
running OONI tests, but merely
asserting that an internet blackout had occurred just because we stopped
receiving measurements probably wouldn’t have been accurate. As such, we started
to refer to other public data sources that could help us gain a better
understanding of potential network disruptions in countries where internet
blackouts were reported by locals.
In this post we outline some basics from our methodology when examining internet
blackouts through public data sources.
Identifying data sources
Our main criterion for identifying data sources that can help shed light on
network disruptions is that they collect and publish a large volume of internet
traffic from as many countries around the world as possible (including, of
course, the country where an internet blackout has been reported), or that they
provide insight into the routing within networks.
Some public data sources, such as Google Transparency Reports,
provide data with large volumes of internet traffic because they are produced by
companies offering internet services used by large populations across many
countries around the world. Other data sources, such as NDT measurements, publish data collected
from probes monitoring network performance globally. And other data sources,
like Tor Metrics, publish daily measurements
from around the world pertaining to the use of particular software.
Data sources that provide insight into the potential routing within networks can
also be useful when examining internet blackouts. BGP data aggregated by
RIPE, for example, enables us to monitor routing
information for the country in question and to examine whether it has been
disconnected from the internet.
In short, some public data sources that we refer to when examining internet
blackouts include the following:
The above list is not exhaustive and the listed data sources present various
limitations. NDT measurement data,
for example, is limited by the amount of probes deployed which may not include
equal coverage across countries around the world, while Google traffic data is
limited by the amount of users Google has in each country of question. Such data
sources, however, can potentially help gain insight into the volume of internet
traffic originating from various countries around the world through further
examination.
Examining data sources
Most public data sources (as listed in the previous section) allow us to select
a country and to observe the flow of internet traffic originating from it across
time. If a country-wide internet blackout has occurred, we would expect to see
almost no internet traffic origination from a country during the reported period
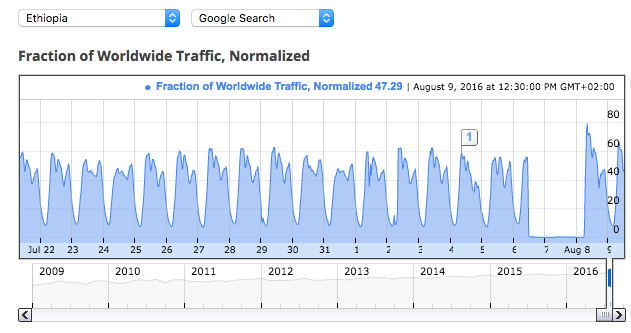
of a blackout. This, for example, was evident in Ethiopia in August 2016, when
an internet blackout was reported in the middle of political protests.
The graph below, taken from Google traffic data,
clearly illustrates that no internet traffic was originating from Ethiopia
between 6th to 8th August, confirming that an internet blackout occurred.
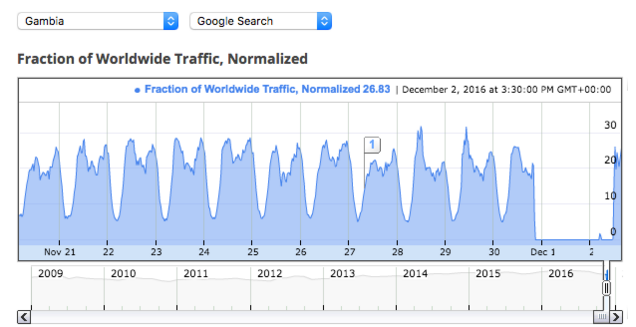
Similarly, Google traffic data in the graph
below shows a clear disruption of internet traffic originating from the Gambia
between 30th November to 2nd December, when an internet blackout was
reported during
the country’s 2016 presidential election.
In addition to Google traffic data, it’s also particularly useful to look at BGP
announcement data aggregated by RIPE from different Remote Route Collectors (RRT) and to examine whether
a country’s prefixes are withdrawn when an internet blackout is being reported.
In the Gambia, for example, such data allowed us to monitor the withdrawal and
announcement of Gambian prefixes during the country’s 2016 presidential
election. In fact, Gambian prefixes were
withdrawn between
30th November to 2nd December, which is consistent with the hypothesis that the
internet blackout occurred during that period, as inferred through Google traffic data.
OONI has been working on a methodology to automatically identify and
investigate cases of internet blackouts. So for this is something very
experimental and will require more work to have it be production ready.
This ipython notebook (view)
contains some of the results of the experiments we have been doing.
The same methodology can easily be applied to other datasets other than the
Google traffic data. It would have been useful, and much easier, if Google
Transparency Reports provided an easy to use HTTP API for obtaining the data.
Cross-referencing data sources
Internet blackout might not always occur across all networks on a country-wide
level. A government, for example, may order ISPs to shut down the internet only
in a specific location where a protest is taking place, while keeping the
internet accessible in the rest of the country. In such a case, it’s probably
unlikely that Google traffic data would show a complete disruption as
illustrated in the graphs of the previous section, but would rather show a
general decrease in traffic data in comparison to previous dates. As such,
cross-referencing data sources as part of an examination of internet blackout
can be a useful next step.
One way of doing so is by looking at both Google traffic data and
Tor Metrics for a particular country during
the same period of time. It’s unlikely, for example, that there would be a total
internet blackout if there is normal usage of the Tor network during a reported blackout. If, however,
there is a spike in Tor usage and Google traffic data is significantly decreased
in comparison to previous dates, then it might be the case that censorship
events are occurring in certain networks, leading to the increased usage of
censorship circumvention software.
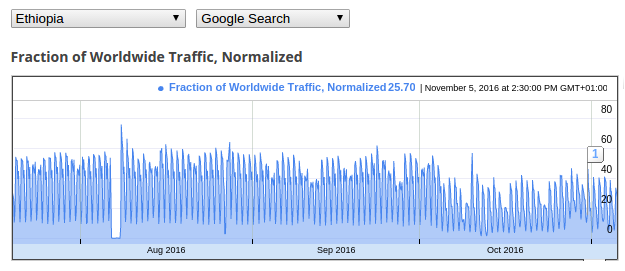
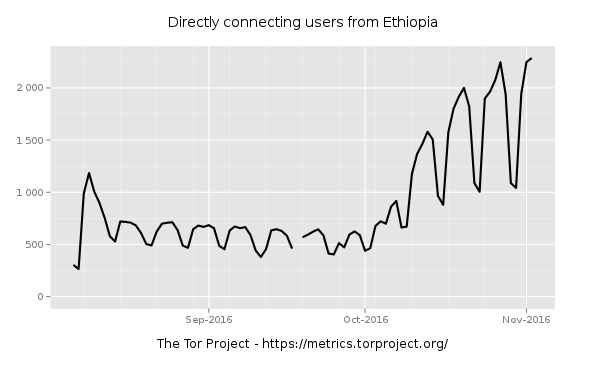
This is illustrated through the example below where we can see decreased Google
traffic data and increased usage of Tor software in Ethiopia
in October 2016.
When cross-referencing data sources, it might also be useful to look at the
geotagging of posts on social media platforms, such as Twitter. Unlike the
aforementioned public data sources (e.g. Google transparency reports) which show
an overview of traffic originating from a country, the geotags on posts allow us
to drill down to a specific region or city in a country (if the geotags are
accurate). This is particularly useful if, for example, locals are reporting a
blackout in a country, Google traffic data does not show a clear blackout, but
you’re interested in examining whether the approximate internet activity
originating from a specific city or region has been disrupted.
This process involves:
Collecting all of the posts of a social media platform (e.g. via Twitter’s API)
that are geotagged with the region that you are interested in;
Calculating the approximate amount of geotagged posts within the time range that
you are interested in;
Evaluating whether there is a significant decrease of geotagged posts on the
specific dates of a reported internet blackout.
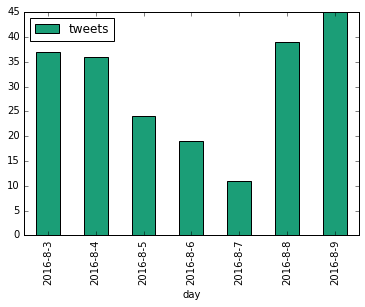
This is illustrated through the graph below that we
created based on tweets geotagged in Ethiopia between 3rd-9th August
2016, indicating a decrease of Twitter activity in the country on 7th August
2016 when an internet blackout was reported in the country.
However, such data should probably only be used supplementary when cross-
referencing data sources, since it is subject to various limitations (for
example, Twitter users in a country might be inactive due to reasons unrelated
to an internet blackout).
Conclusion
Unless all data sources that you refer to show absolutely no internet traffic
originating from a country or the prefixes within a country are completely
withdrawn, it’s hard to reach an accurate conclusion on whether an internet
blackout has occurred or not.
Nonetheless, the publicly available data sources mentioned in this post can help
gain some insight into the flow of internet traffic in most countries around the
world, and they can help provide signs of internet blackout.
We encourage more companies (such as Akamai,
CloudFlare and Fastly)
to publish data on network traffic originating from countries to help increase
transparency when heavy network disruptions occur. We also encourage you all to
support Access Now’s #KeepItOn campaign
for a stable and open internet around the world.